How to Use LaTeX in Microsoft Word: A Guide with Example Equations
LaTeX is a powerful typesetting system often used for technical and scientific documents. It allows for precise formatting, especially for mathematical equations and complex notations. While LaTeX is typically associated with coding or using tools like Overleaf, it’s also possible to use LaTeX in Microsoft Word, making it a valuable tool for researchers, students, and professionals who want to present technical content clearly.
In this blog post, we’ll explore how to use LaTeX in Microsoft Word for formatting mathematical equations. As an example, we will walk through some common classification accuracy metrics used in remote sensing and machine learning, including Overall Accuracy (OA), Standard Error (SE), User Accuracy (UA), Producer Accuracy (PA), F1 Score, and Kappa Coefficient.
Why Use LaTeX in Microsoft Word?
Microsoft Word’s native equation editor allows you to write mathematical formulas directly within your documents. However, for those who are already familiar with LaTeX, it’s a much more efficient way of formatting equations. LaTeX offers several advantages, such as:
-
Clear and accurate formatting for complex equations
-
Consistent formatting across different documents and platforms
-
Flexibility for including symbols, fractions, integrals, matrices, and more
-
Ease of use for users with existing LaTeX knowledge
How to Use LaTeX in Microsoft Word
Follow these simple steps to insert LaTeX equations in Microsoft Word:
-
Open Word: Start by opening a new or existing document in Microsoft Word.
-
Insert Equation:
-
Navigate to the Insert tab in the ribbon.
-
Click on Equation (it’s usually represented by the
πsymbol). This opens the equation editor where you can type your LaTeX code.
-
-
Enter LaTeX:
-
Click on Insert New Equation.
-
After the equation box opens, type
Alt+=to get a LaTeX editor where you can input your formulas.
-
-
Use LaTeX Code:
-
Type the LaTeX equation directly into the equation editor (explained below).
-
-
Switch to Professional View: The equations will automatically be formatted as professional-style equations once you hit Enter. You can also change the format by clicking on the Equation dropdown in the ribbon and selecting the Professional option.
Now, let's take a look at how you can format some essential classification accuracy equations using LaTeX in Microsoft Word.
Example Equations in LaTeX: Classification Accuracy Metrics
Below are six important classification accuracy metrics, commonly used in remote sensing, machine learning, and other scientific fields. We will provide the LaTeX code for each equation and a brief explanation of what each metric represents.
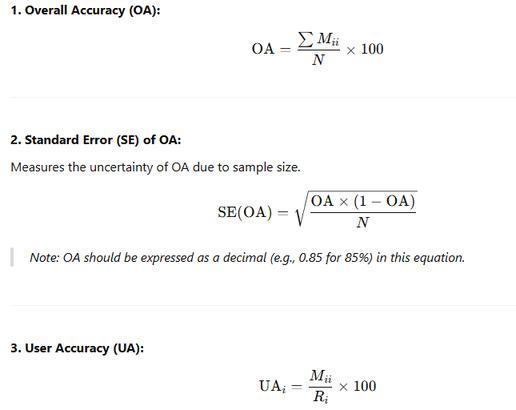
1. Overall Accuracy (OA)
Overall Accuracy (OA) is a measure of the proportion of correctly classified instances out of all tested instances.
LaTeX Code:
\text{Overall Accuracy (OA)} = \frac{\sum M_{ii}}{N} \times 100
Definition:
This metric is used to calculate the percentage of correctly classified pixels in the overall dataset. The numerator is the sum of the diagonal elements of the confusion matrix (correct classifications), while the denominator is the total number of samples.
2. Standard Error (SE) of OA
The Standard Error (SE) is used to understand the variability of the overall accuracy (OA).
LaTeX Code:
\text{Standard Error (SE)} = \sqrt{ \frac{OA \cdot (1 - OA)}{N} }
Definition:
The SE provides a measure of the uncertainty associated with the Overall Accuracy. It takes into account the number of samples (N) and the OA itself to estimate how much the accuracy might vary.
3. User Accuracy (UA)
User Accuracy (UA) measures the percentage of correctly classified pixels for a particular class, considering only those pixels that were classified as that class.
LaTeX Code:
\text{User Accuracy (UA)}_i = \frac{M_{ii}}{R_i} \times 100
Definition:
User Accuracy is calculated by dividing the number of correctly classified pixels for a class (the diagonal elements of the confusion matrix) by the total number of pixels assigned to that class (the row sum). This metric tells you how reliable a classification is for each class.
4. Producer Accuracy (PA)
Producer Accuracy (PA) is the proportion of correctly classified pixels of a class, considering only those pixels that actually belong to that class.
LaTeX Code:
\text{Producer Accuracy (PA)}_i = \frac{M_{ii}}{C_i} \times 100
Definition:
Producer Accuracy measures how well the classification method detects pixels belonging to a particular class. It is the ratio of correctly classified pixels (from the confusion matrix) to the total number of pixels that actually belong to the class.
5. F1 Score
The F1 Score is a metric that combines the precision and recall into a single value, providing a balanced measure of a classifier's accuracy.
LaTeX Code:
\text{F1 Score}_i = 2 \cdot \frac{UA_i \cdot PA_i}{UA_i + PA_i}
Definition:
The F1 Score takes into account both the User Accuracy (UA) and Producer Accuracy (PA). A value of 1 indicates perfect precision and recall, while values closer to 0 suggest poorer performance. This metric is particularly useful when dealing with imbalanced datasets.
6. Kappa Coefficient (κ)
The Kappa Coefficient (κ) measures the agreement between the classification results and the reference data, taking into account the possibility of agreement occurring by chance.
LaTeX Code:
\kappa = \frac{N \cdot \sum M_{ii} - \sum (R_i \cdot C_i)}{N^2 - \sum (R_i \cdot C_i)} \times 100
Definition:
Kappa is a statistical measure of inter-rater agreement. It corrects for chance agreement, meaning that if the classification was random, the Kappa score would be 0. A score of 1 indicates perfect agreement, and negative values suggest worse-than-chance agreement.
Thanks — let's now calculate the Standard Error (SE) and express the 95.48% confidence interval for the new overall accuracy (OA).
📘 Given:
-
OA = 0.9296
-
Total number of validation points (N) = 6503
Using the formula:
SE=OA⋅(1−OA)N\text{SE} = \sqrt{ \frac{OA \cdot (1 - OA)}{N} }
🔢 Step-by-step:
SE=0.9296⋅(1−0.9296)6503=0.9296⋅0.07046503=0.06546503=0.00001005≈0.00317SE = \sqrt{ \frac{0.9296 \cdot (1 - 0.9296)}{6503} } = \sqrt{ \frac{0.9296 \cdot 0.0704}{6503} } = \sqrt{ \frac{0.0654}{6503} } = \sqrt{0.00001005} \approx 0.00317
🟦 Confidence Interval at 95.48%:
Use z≈2z \approx 2:
Margin of Error=2⋅SE=2⋅0.00317=0.00634\text{Margin of Error} = 2 \cdot SE = 2 \cdot 0.00317 = 0.00634 Confidence Interval=0.9296±0.0063\text{Confidence Interval} = 0.9296 \pm 0.0063
✅ Final Answer:
-
Standard Error: 0.00317\boxed{0.00317}
-
Overall Accuracy: 0.9296±0.0063\boxed{0.9296 \pm 0.0063}
-
Or in percentage terms:
92.96%±0.63%\boxed{92.96\% \pm 0.63\%}
Let me know if you'd like this for another confidence level (e.g., 99%) or for class-specific metrics.


0% Positive Review (0 Comments)