
Automating Water Body Detection and Shapefile Creation from Satellite Imagery Using Python
In the realm of remote sensing and geographic information systems (GIS), detecting water bodies from satellite imagery is a crucial task for environmental monitoring, resource management, and disaster response. In this blog post, we'll explore how to automate the process of detecting water bodies from satellite images and saving them as shapefiles using Python.
Prerequisites
!pip install rasterio

!pip install earthpy # Make more better Map (Title Legands)

!pip install rasterio shapely geopandas
Step 1: Import the Necessary Libraries
First, we'll import the required libraries. To keep the code clean and concise, we'll use shortened aliases for some of the libraries.
import numpy as np

import rasterio as rio

from rasterio.plot import reshape_as_image

import matplotlib.pyplot as plt

import earthpy.plot as ep # To make library name short like ep with

import rasterio.features

import geopandas as gpd

from shapely.geometry import shape
Step 2: Open the Raster File and Read Image Data
# Open the raster file
with rio.open('/path/to/your/image.tif') as src:
    img = reshape_as_image(src.read())

# Extract the red, green, blue, and NIR bands
red = img[:, :, 6]
green = img[:, :, 4]
blue = img[:, :, 2]
nir = img[:, :, 8]

# Combine the RGB bands for visualization
rgb = np.dstack((red, green, blue))
Step 3: Visualize the True Color Image
plt.figure(figsize=[20, 20])
plt.imshow(rgb * 4)
plt.axis('off')
plt.title("True Color Image of Tarash", fontsize=16)
plt.show()
Step 4: Calculate and Visualize NDVI
The Normalized Difference Vegetation Index (NDVI) is a commonly used vegetation index that can also be used to differentiate between water bodies and land. We'll calculate NDVI and plot it to visualize the vegetation cover.
NDVI = (nir - red) / (nir + red)

plt.figure(figsize=[10, 10])
plt.imshow(NDVI, cmap='RdYlGn')
plt.colorbar(label='NDVI')
plt.title('NDVI Map of Tarash', fontsize=16)
plt.axis('off')
plt.show()

ep.plot_bands(NDVI, cmap='RdYlGn', title='NDVI MAP of Tarash', figsize=(10, 10))
Step 5: Extract Water Bodies from NDVI
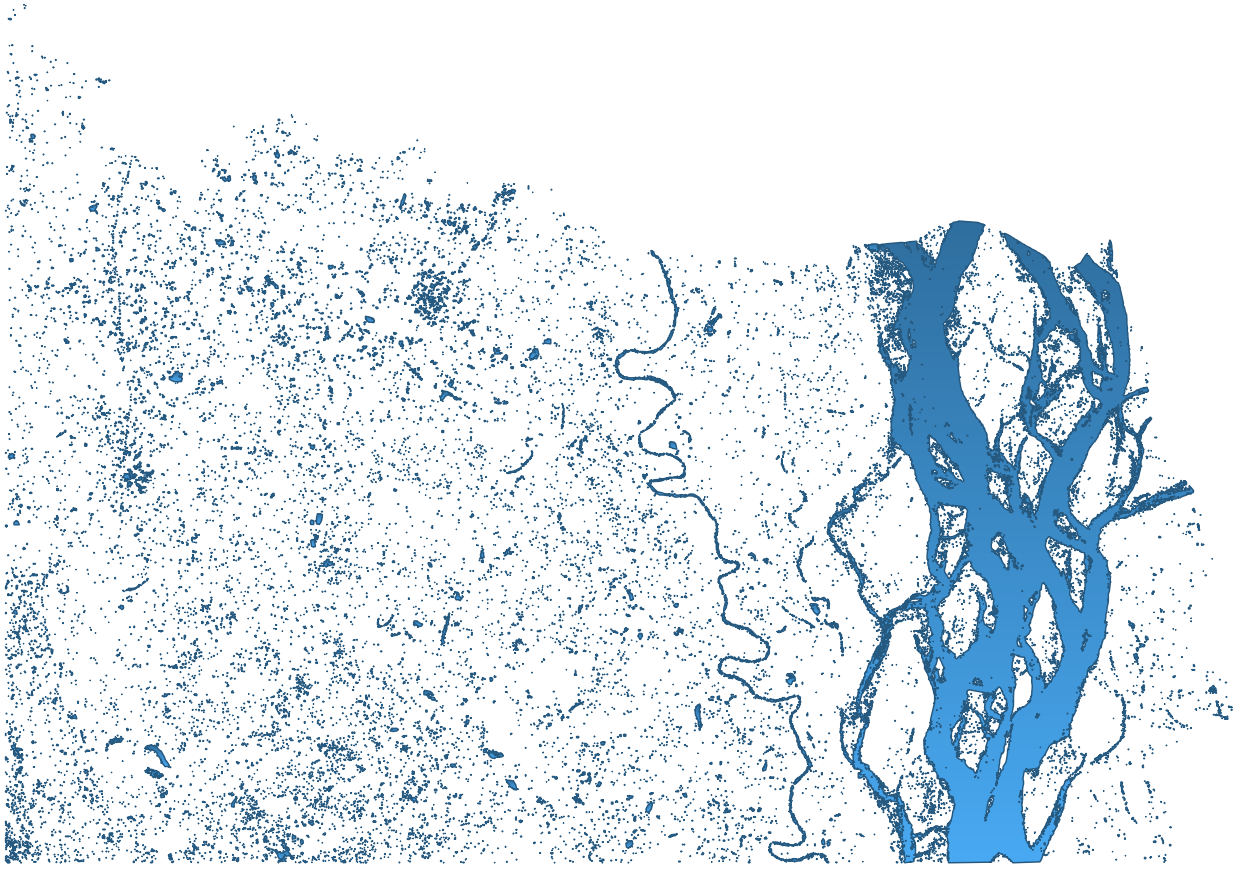
Water bodies typically have negative NDVI values. We'll create a binary mask where NDVI values less than zero indicate the presence of water.
water = NDVI < 0

ep.plot_bands(water, cmap='Blues', title='Water Body Map of Tarash', figsize=(10, 10))
Step 6: Save the Water Body Map as an Image
We can save the water body map as an image for future reference or reports.
plt.figure(figsize=[10, 10])
plt.imshow(water, cmap='Blues')
plt.title('Water Body Map of Tarash', fontsize=16)
plt.axis('off')
plt.savefig('Water_Body_Map_of_Tarash.png', dpi=300, bbox_inches='tight')
plt.show()
Step 7: Convert the Water Body Mask to a Shapefile
Finally, we'll convert the binary water body mask into vector polygons and save them as a shapefile.
mask = water.astype(np.uint8)

with rio.open('/path/to/your/image.tif') as src:
    transform = src.transform

shapes = list(rio.features.shapes(mask, transform=transform))

geometries = [shape(geom) for geom, value in shapes if value == 1]

gdf = gpd.GeoDataFrame(geometry=geometries, crs=src.crs)

gdf.to_file('Water_Bodies_Tarash.shp')

print("Shapefile saved successfully.")
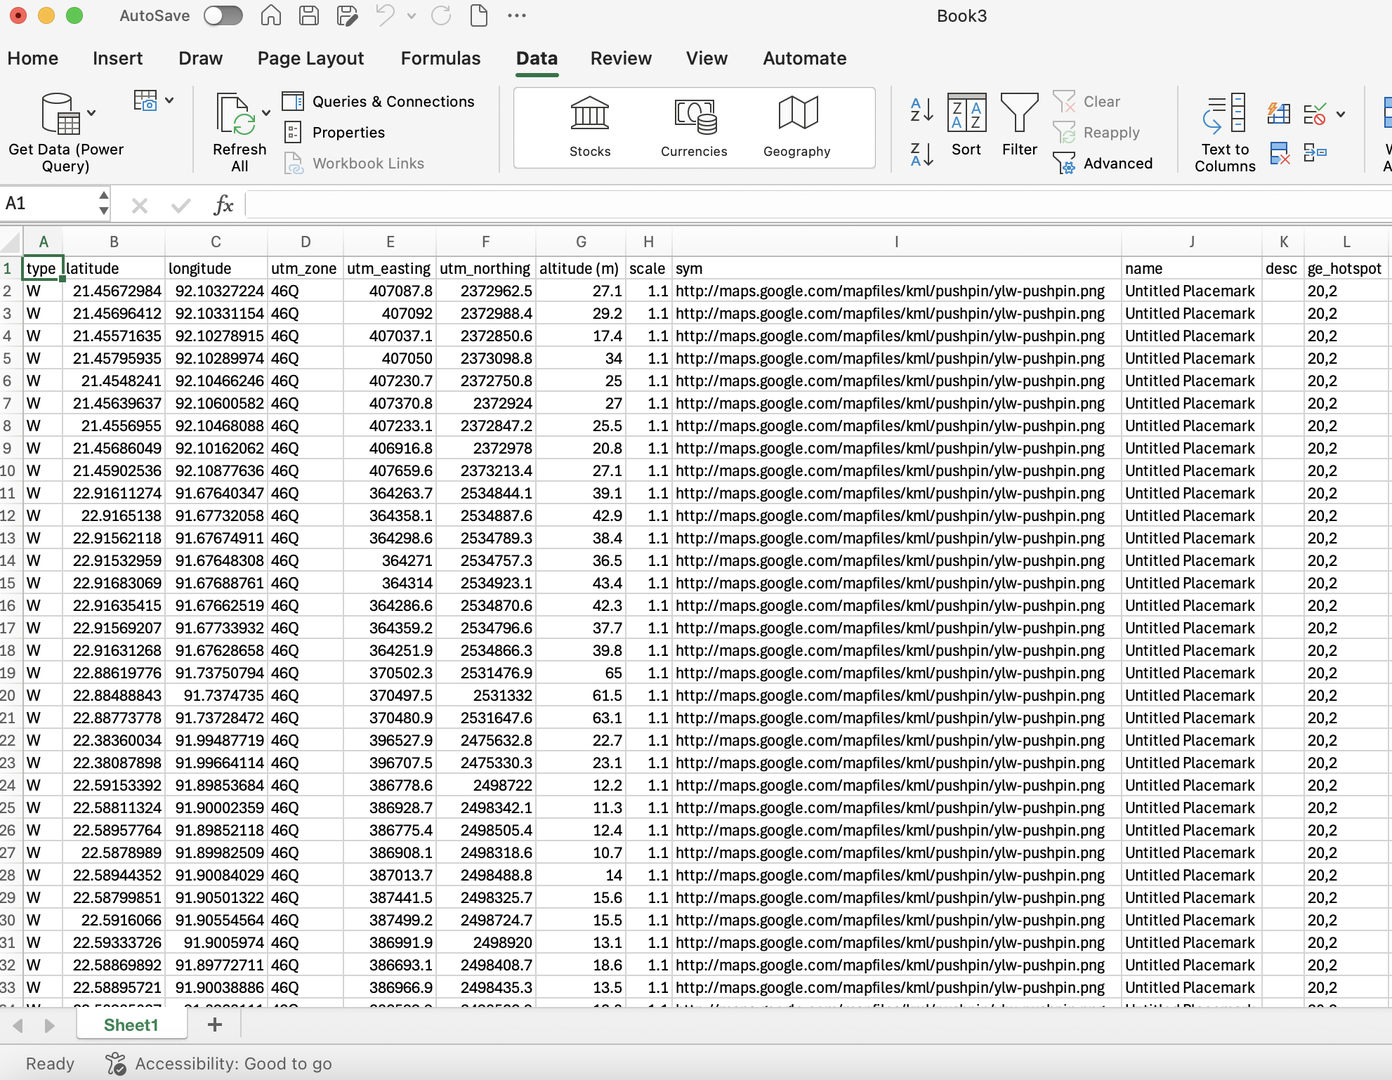
export the latitude and longitude coordinates of the water bodies to a CSV file
import geopandas as gpd
import csv

# Load the shapefile containing the water bodies
gdf = gpd.read_file('Water_Bodies_Tarash.shp')

# If the CRS is not in WGS84 (latitude/longitude), reproject it
if gdf.crs != 'EPSG:4326':
    gdf = gdf.to_crs('EPSG:4326')

# Create a list to hold the coordinates
water_body_coords = []

# Extract the latitude and longitude coordinates
for geom in gdf.geometry:
    if geom.geom_type == 'Polygon':
        for coord in list(geom.exterior.coords):
            lat, lon = coord[1], coord[0]
            water_body_coords.append((lat, lon))
    elif geom.geom_type == 'MultiPolygon':
        for poly in geom:
            for coord in list(poly.exterior.coords):
                lat, lon = coord[1], coord[0]
                water_body_coords.append((lat, lon))

# Define the CSV file name
csv_file = 'water_body_coordinates.csv'

# Write the coordinates to the CSV file
with open(csv_file, mode='w', newline='') as file:
    writer = csv.writer(file)
    writer.writerow(['Latitude', 'Longitude'])  # Write the header
    writer.writerows(water_body_coords)  # Write the data

print(f"Coordinates successfully exported to {csv_file}")
Conclusion
In this blog post, we demonstrated how to automate the detection of water bodies from satellite imagery using Python. By leveraging powerful libraries like rasterio, geopandas, and shapely, we efficiently processed the raster data, extracted relevant features, and saved them as shapefiles for further GIS analysis.
This approach can be adapted to other types of land cover classification and is a valuable tool in the fields of environmental monitoring, resource management, and spatial analysis. Whether you're a researcher, a GIS professional, or an enthusiast, these techniques can help you unlock the potential of remote sensing data.


100% Positive Review (1 Comment)
Sara Wilsson
"Excellent! I learned so much from this post."