
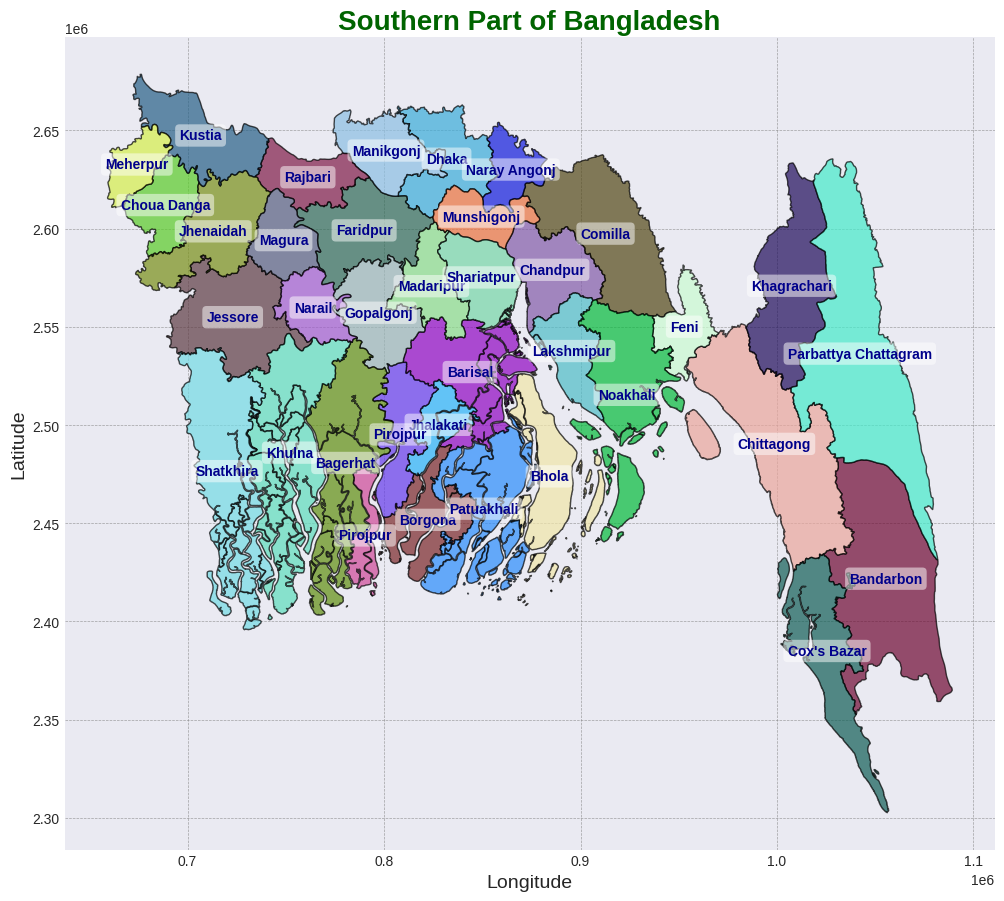
Exploring the Southern Part of Bangladesh: Calculating Land Area Using Python
As the world increasingly turns to data for insights, understanding geographic information has become more vital than ever. In this blog post, we will delve into how to calculate land area using Python, specifically focusing on the southern part of Bangladesh. We'll leverage the powerful geopandas library to analyze spatial data efficiently.
Understanding the Context
The southern region of Bangladesh is rich in natural beauty and cultural heritage, but it also faces unique environmental challenges. Accurate land area calculations can help in urban planning, resource management, and environmental conservation efforts. By using geographic data, we can gain insights into how land is being used and how it can be managed better.
Setting Up the Environment
To get started, you'll need to install the geopandas library if you haven't already. You can do this via pip:
pip install geopandas
Loading and Preparing the Shapefile
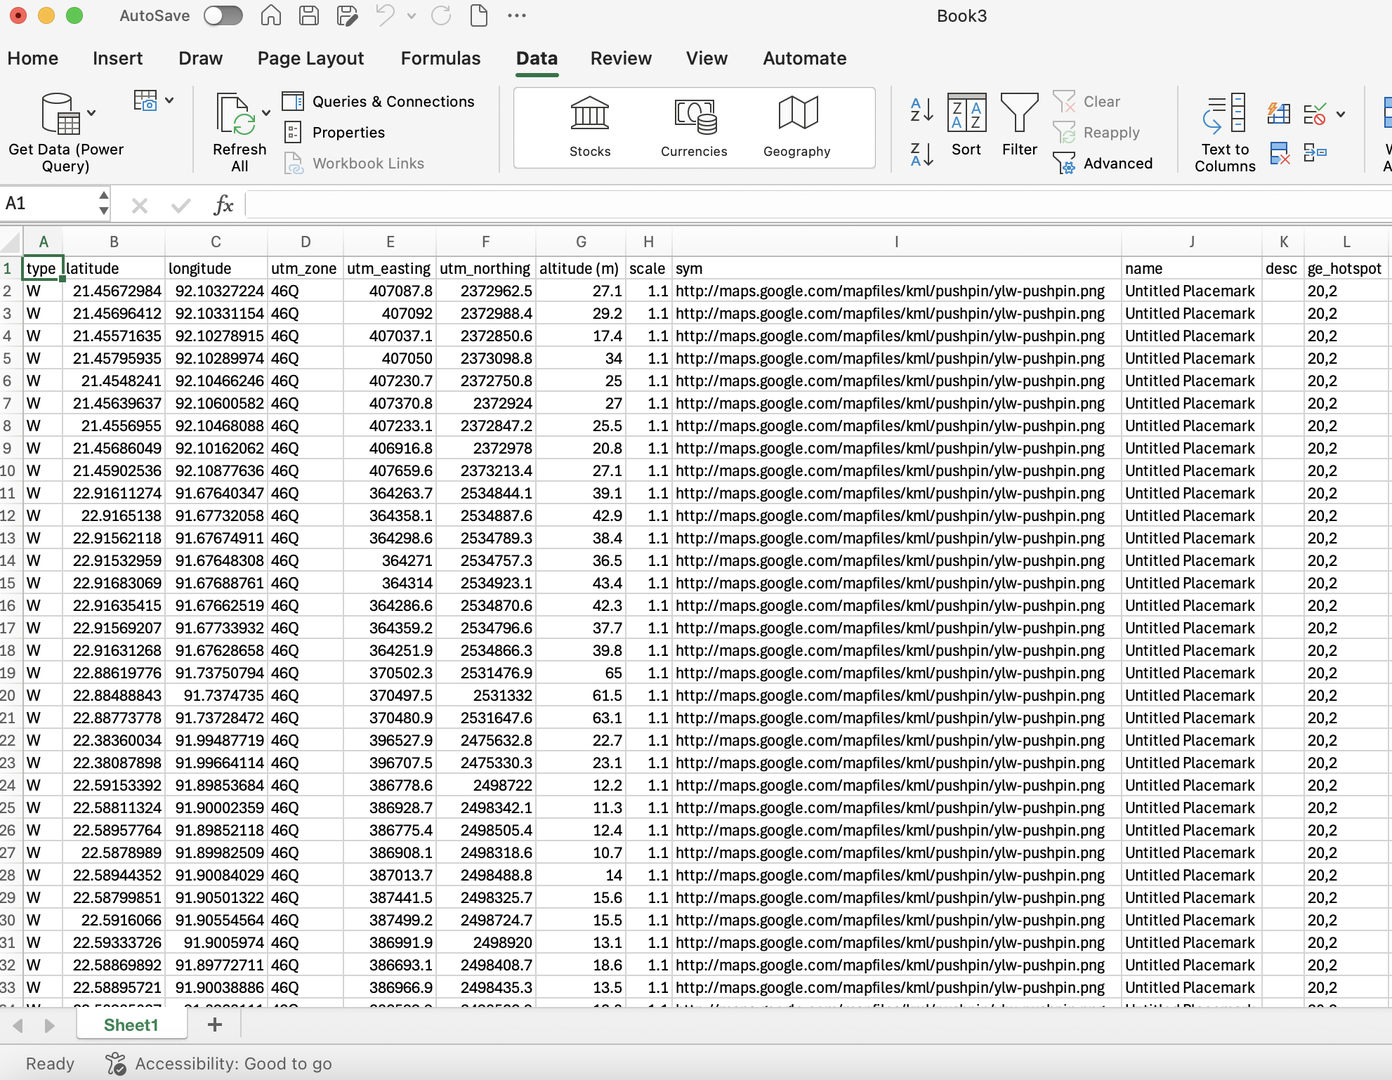
For this analysis, we will use a shapefile that contains the boundaries of the southern part of Bangladesh. Shapefiles are a popular format for storing the geometric location and attribute information of geographic features.
Here’s a sample code snippet to load the shapefile and reproject it for accurate area calculations:
import geopandas as gpd

# Load the shapefile
shapefile_path = '/path/to/your/shapefile/southbd.shp'  # Replace with your actual path
gdf = gpd.read_file(shapefile_path)

# Reproject to a suitable projected CRS (e.g., UTM)
gdf = gdf.to_crs(epsg=32645)  # UTM zone 45N for southern Bangladesh
Calculating Individual and Total Areas
Once we have our GeoDataFrame (gdf), we can calculate the area for each geometry. Here’s how to do that:
# Calculate area in square meters
gdf['area_m2'] = gdf.geometry.area

# Convert to square kilometers
gdf['area_km2'] = gdf['area_m2'] / 1_000_000

# Calculate total area
total_area_m2 = gdf['area_m2'].sum()
total_area_km2 = gdf['area_km2'].sum()

# Display results
print(gdf[['geometry', 'area_m2', 'area_km2']])
print(f"Total Area: {total_area_m2:.2f} m²")
print(f"Total Area: {total_area_km2:.2f} km²")
Understanding the Output
The output of the code will show each geometric feature along with its area in both square meters and square kilometers. Additionally, you will get the total area for all the features combined, giving you a clear understanding of the land extent in the southern part of Bangladesh.
Implications of Area Calculations
Calculating land area is more than just a number. It helps in:
- Urban Planning: Understanding how much land is available for development and conservation.
- Resource Management: Efficiently allocating resources based on land area.
- Environmental Protection: Identifying critical areas that require conservation efforts.
Code to Create a Feature Image
import geopandas as gpd
import matplotlib.pyplot as plt
import numpy as np
from matplotlib import style

# Set a style for the plot
style.use('seaborn-darkgrid')

# Load the shapefile
shapefile_path = '/content/drive/MyDrive/Shapefile/southernpart/southbd.shp'  # Replace with your actual path
gdf = gpd.read_file(shapefile_path)

# Reproject to a suitable projected CRS (e.g., UTM)
gdf = gdf.to_crs(epsg=32645)

# Generate random colors for each polygon
def random_color():
    return np.random.rand(3,)  # Returns an RGB tuple with values between 0 and 1

colors = [random_color() for _ in range(len(gdf))]

# Create a figure and axis
fig, ax = plt.subplots(figsize=(12, 12))

# Plot the geometries with random colors
gdf.plot(ax=ax, color=colors, edgecolor='black', alpha=0.7)

# Add labels for each polygon with enhanced visibility
for x, y, label in zip(gdf.geometry.centroid.x, gdf.geometry.centroid.y, gdf['NAME_2']):
    ax.text(x, y, label, fontsize=10, ha='center', va='center', color='darkblue', weight='bold', bbox=dict(facecolor='white', alpha=0.5, edgecolor='none', boxstyle='round,pad=0.3'))

# Title and labels with enhanced formatting
ax.set_title('Southern Part of Bangladesh', fontsize=20, weight='bold', color='darkgreen')
ax.set_xlabel('Longitude', fontsize=14)
ax.set_ylabel('Latitude', fontsize=14)

# Add grid lines for better readability
ax.grid(color='gray', linestyle='--', linewidth=0.5, alpha=0.7)

# Save the figure
plt.savefig('southern_bangladesh_map_random_colors.png', dpi=300, bbox_inches='tight')
plt.show()
Conclusion
By using Python and geopandas, we can easily manipulate geographic data and derive meaningful insights about land usage. As we continue to explore the southern part of Bangladesh, such analyses can empower decision-makers to make informed choices that benefit both the environment and local communities.
Whether you're a researcher, urban planner, or simply a geography enthusiast, mastering geographic data analysis can provide valuable tools to understand and shape our world. Happy coding!


0% Positive Review (0 Comments)