
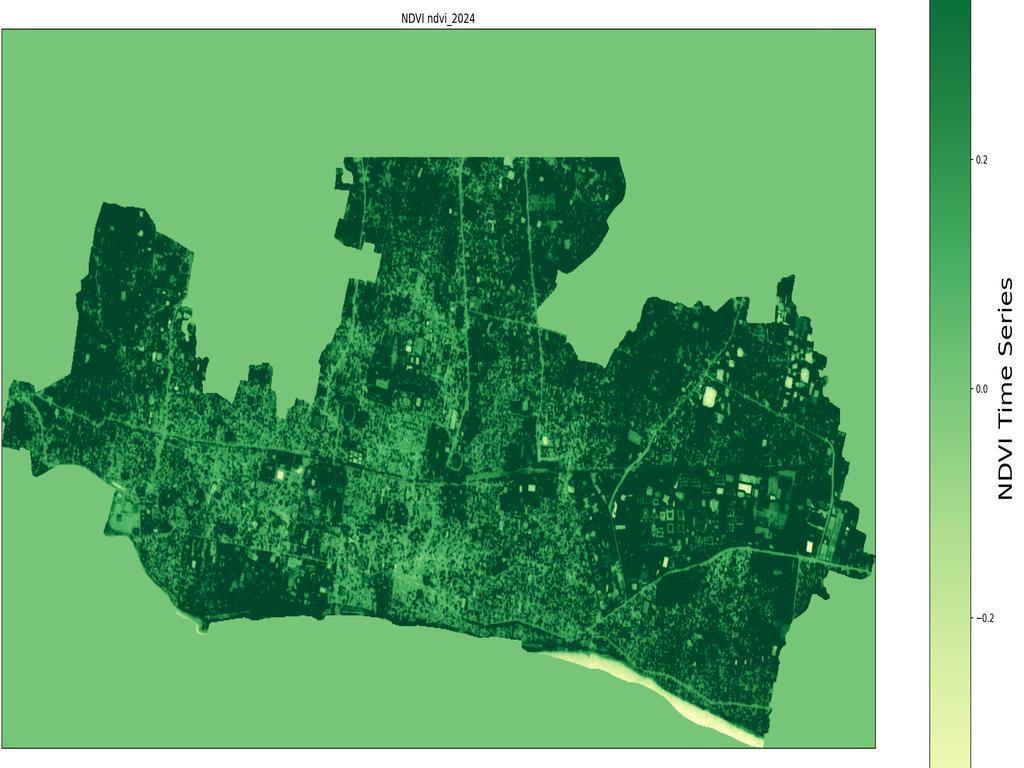
Time lapse Animation NDVI of Sentinel-2 using Python & Jupyter Notebook
Step 1: Install Required Libraries
# Install Libraries
!pip install earthengine-api geemap
!pip install geopandas
!pip install rasterio
!pip install imageio
!pip install numpy
!pip install matplotlib
!pip install pandas
Step 2: Authenticate and Initialize Google Earth Engine
# Import Libraries
import os
import imageio
import imageio.v2 as imageio
import numpy as np
import geopandas as gpd
import pandas as pd
import matplotlib
import matplotlib.pyplot as plt
import matplotlib.pyplot as mplot
import matplotlib.image as mpimg
import matplotlib.colors as colors
from matplotlib.colors import ListedColormap
import rasterio
from rasterio.plot import show, show_hist
import ee
import geemap

# Authenticate and initialize Earth Engine
ee.Authenticate()
ee.Initialize()
Step 3: Define ROI using shapefile
# Load the shapefile using geopandas
shapefile_path = '/home/manik/jupyter/RAJ_CC/RajCC.shp'
gdf = gpd.read_file(shapefile_path)

# Convert the geopandas GeoDataFrame to a GeoJSON string
geojson_str = gdf.to_json()

# Parse the GeoJSON string into a dictionary
geojson_dict = json.loads(geojson_str)

# Create an Earth Engine FeatureCollection from the GeoJSON dictionary
aoi_fc = geemap.geojson_to_ee(geojson_dict)

# Extract the geometry from the FeatureCollection
aoi = aoi_fc.geometry()
Step 4: Define the NDVI Calculation, Visualization Parameters & Download the NDVI Image
# Define the years for which you want to calculate NDVI
years = [2021, 2022, 2023, 2024]

# Define the date range for each year
start_date = '01-01'
end_date = '08-10'

# Define the output directory
out_dir = '/home/manik/jupyter/NDVI2'

# Create the directory if it does not exist
os.makedirs(out_dir, exist_ok=True)

# Now you can proceed with saving files to out_dir

for year in years:
    # Load Sentinel-2 image collection for the specific year
    image = ee.ImageCollection('COPERNICUS/S2_SR_HARMONIZED') \
        .filterDate(f'{year}-{start_date}', f'{year}-{end_date}') \
        .filterBounds(aoi) \
        .first()

    # Calculate NDVI
    ndvi = image.normalizedDifference(['B8', 'B4']).rename('NDVI')

    # Define the output file name
    out_file = f'{out_dir}/ndvi_{year}.tif'

    # Export the NDVI image
    geemap.ee_export_image(ndvi.clip(aoi), filename=out_file, scale=10, region=aoi, file_per_band=False)

    print(f"NDVI image for {year} saved to {out_file}")
Step 5: Verify the Download
for year in years:
    out_file = f'{out_dir}/ndvi_{year}.tif'

    # Open the image
    with rasterio.open(out_file) as src:
        ndvi_image = src.read(1)

    # Display the image
    plt.imshow(ndvi_image, cmap='YlGn')
    plt.colorbar()
    plt.title(f'NDVI {year}')
    plt.show()
Step 5: Setup input and output directory for Animated NDVI
# Define the input and output directories
inDir = '/home/manik/jupyter/NDVI2'
outDir = os.path.join(os.path.dirname(inDir), 'animation')

# Create the input directory if it does not exist
if not os.path.exists(inDir):
    os.makedirs(inDir)

# Change working directory to input directory
os.chdir(inDir)

# Create the output directory if it does not exist
if not os.path.exists(outDir):
    os.makedirs(outDir)
Step 6: Generate NDVI Images with Custom Titles and Colormaps"
# Get list of .tif files in the current directory
fileList = [file for file in os.listdir() if file.endswith('.tif')]

for f in fileList:
    lcpri_file = rasterio.open(f)
    lcpri = lcpri_file.read(1)

    # Use a valid colormap
    cmap = 'YlGn'
    cmap_reversed = matplotlib.colormaps.get_cmap('YlGn_r')

    plt.figure(figsize=[20, 15])
    plt.imshow(lcpri, cmap=cmap, vmin=-0.5, vmax=0.5)

    # Split the filename and handle cases where "-" is not present
    parts = f.split("-")
    if len(parts) > 1:
        fileName = parts[1][:-4]
    else:
        fileName = f[:-4]  # Use the entire filename without extension if "-" is not present

    print('Processing: {}'.format(fileName))

    plt.title('NDVI ' + fileName)

    cur_axes = plt.gca()
    cur_axes.axes.get_xaxis().set_visible(False)
    cur_axes.axes.get_yaxis().set_visible(False)

    cb = plt.colorbar()
    cb.set_label('NDVI Time Series', size=24)

    plt.tight_layout()
    plt.savefig(f'{outDir}{fileName}_NDVI.png', dpi=150)
    plt.close()
Step 7: Create GIF Animation from Image Frames: Combine PNGs into Animated NDVI GIF
def make_gif(input_folder, save_filepath):
    episode_frames = []
    time_per_step = 0.40
    for root, _, files in os.walk(input_folder):
        file_paths = [os.path.join(root, file) for file in files]
        file_paths = sorted(file_paths, key=lambda x: os.path.getmtime(x))
        episode_frames = [imageio.imread(file_path) for file_path in file_paths if file_path.endswith('.png')]

    # Convert list to numpy array (optional, only needed if further processing is required)
    episode_frames = np.array(episode_frames)

    # Save frames as GIF
    imageio.mimsave(save_filepath, episode_frames, duration=time_per_step)

make_gif(outDir, os.path.join(outDir, "Animation_NDVI.gif"))
print("Created animation file")
Step 7: Display Generated GIF Animation in Jupyter Notebook
from IPython.display import Image, display

# Use the correct file path for the GIF
gif_path = os.path.join(outDir, 'Animation_NDVI.gif')

# Open and display the GIF
with open(gif_path, 'rb') as f:
    display(Image(data=f.read(), format='gif'))


0% Positive Review (0 Comments)