
Identify Healthy and Stressed Vegetation with Hyperspectral Remote Sensing
Effective crop health monitoring is essential for maximizing yields and ensuring sustainable agriculture. While traditional methods are often labor-intensive, hyperspectral remote sensing, combined with Google Earth Engine (GEE), offers a more advanced and efficient solution.
What is Hyperspectral Remote Sensing?
Hyperspectral remote sensing involves capturing and analyzing a wide spectrum of light from the Earth's surface. Unlike conventional multispectral imaging, which uses broad wavelength bands, hyperspectral sensors capture hundreds of narrow bands across the electromagnetic spectrum. This detailed spectral information allows for precise identification of materials and conditions on the ground.
Why Use Hyperspectral Data for Crop Health?
Hyperspectral data provides several advantages for crop health monitoring:
- Enhanced Sensitivity: It can detect subtle changes in crop conditions that might be missed by other imaging methods.
- Detailed Vegetation Analysis: By analyzing specific spectral bands, hyperspectral imaging can differentiate between various types of vegetation stress.
- Precision Agriculture: It enables farmers to pinpoint problem areas within a field, allowing for targeted interventions and resource management.
Google Earth Engine: A Game-Changer for Remote Sensing
Google Earth Engine is a cloud-based platform that provides access to a vast archive of satellite imagery and geospatial data. It allows users to analyze large datasets quickly and efficiently using powerful algorithms and computing resources. For hyperspectral remote sensing, GEE offers an accessible way to process and visualize complex data.
Practical Implementation: Monitoring Crop Health with Hyperspectral Data
Let's dive into a practical example of using hyperspectral remote sensing for crop health monitoring using Google Earth Engine.
-
Access Hyperspectral Data: To start, you'll need hyperspectral imagery from a suitable source. For instance, the NEON (National Ecological Observatory Network) hyperspectral datasets provide detailed reflectance information for various sites.
-
Process the Data: Using Google Earth Engine, you can filter and process hyperspectral images. Here’s a basic workflow:
- Filter Data by Date and Location: Select imagery based on the date range and geographic area of interest.
- Calculate Vegetation Indices: Indices like the Normalized Difference Vegetation Index (NDVI) are calculated to assess vegetation health.
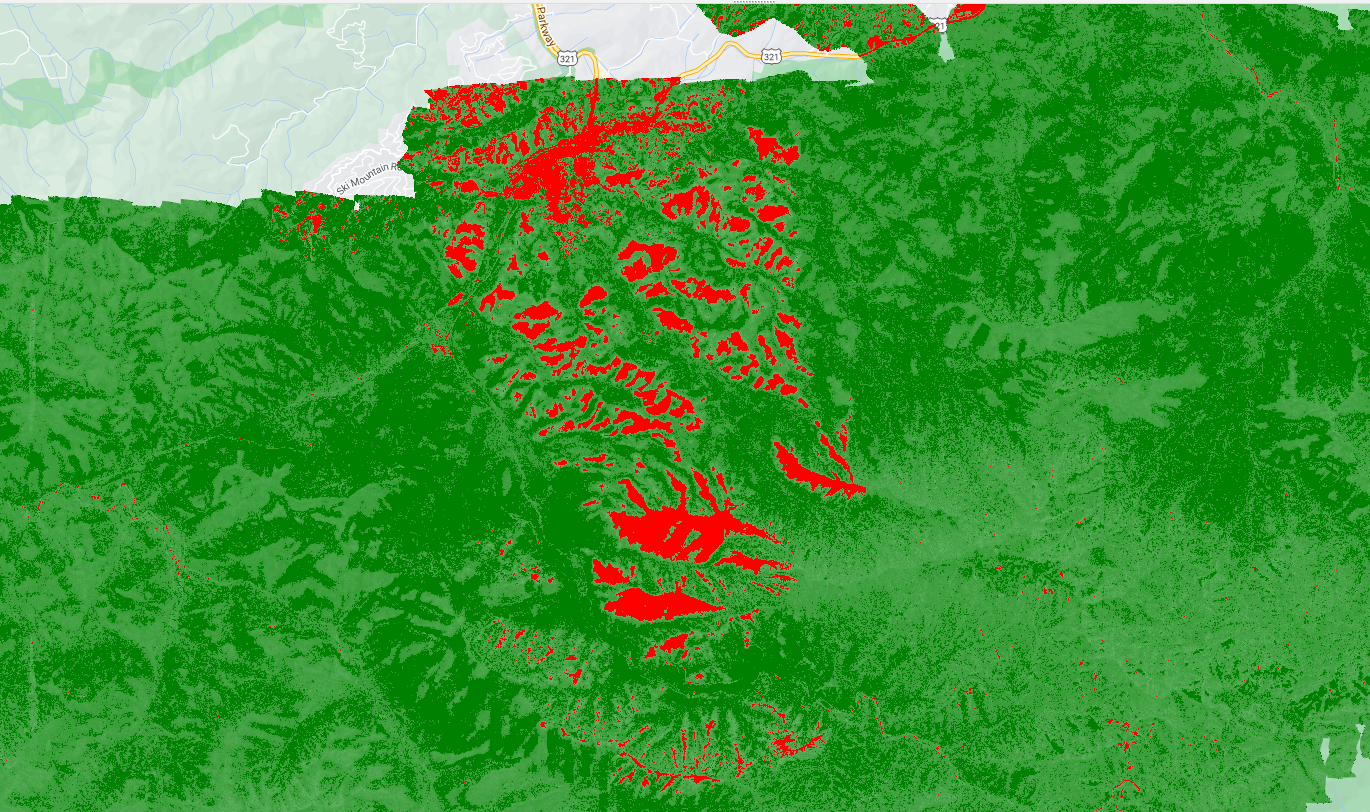
var refl001 = ee.ImageCollection("projects/neon-prod-earthengine/assets/HSI_REFL/001"); // Print the available images print('NEON Directional Surface Reflectance Images:', refl001.aggregate_array('system:index')); var startDate = ee.Date('2017-01-01'); var endDate = startDate.advance(1, 'year'); // Filter by date range var refl001_2017 = refl001.filterDate(startDate, endDate); // Filter by NEON site MRSM (Great Smoky Mountains National Park) var refIGRSM_2017 = refl001_2017.filter(ee.Filter.eq('NEON_SITE', 'GRSM')).mosaic(); // Define visualization parameters for RGB var rgbvis = { min: 340, // Minimum reflectance value for visualization max: 2150, // Maximum reflectance value for visualization bands: ['B053', 'B035', 'B0191'], // Red, Green, Blue bands for RGB gamma: 2 // Gamma correction for brightness }; // Add the NEON reflectance layer to the Map with RGB visualization Map.addLayer(refIGRSM_2017, rgbvis, 'Reflectance RGB Image'); // Select NIR and Red bands from NEON hyperspectral image var nirBand = refIGRSM_2017.select('B170'); // Near Infrared (around 850 nm) var redBand = refIGRSM_2017.select('B050'); // Red Band (around 665 nm) // Calculate NDVI var ndvi = nirBand.subtract(redBand).divide(nirBand.add(redBand)).rename('NDVI'); // Add NDVI layer to the Map Map.addLayer(ndvi, {min: -1, max: 1, palette: ['blue', 'white', 'green']}, 'NDVI'); // Define thresholds for healthy and stressed vegetation var healthyVegetation = ndvi.gt(0.8).selfMask(); var stressVegetation = ndvi.lt(0.6).selfMask(); // Add healthy vegetation layer to the Map Map.addLayer(healthyVegetation, {palette: ['green']}, 'Healthy Vegetation'); // Add stressed vegetation layer to the Map Map.addLayer(stressVegetation, {palette: ['red']}, 'Stressed Vegetation'); // Center the map on the area of interest (for example, using a point in the Great Smoky Mountains) Map.setCenter(-83.5, 35.7, 10); // Longitude, Latitude, Zoom level -
Visualize the Results: Visualization is key to interpreting the data. You can create color-coded maps to display various levels of vegetation health.
Conclusion
Hyperspectral remote sensing, when combined with the analytical power of Google Earth Engine, provides a sophisticated approach to monitoring crop health. It offers farmers and agricultural professionals detailed insights into crop conditions, enabling more effective and precise management strategies. As technology continues to advance, the integration of remote sensing and data analytics will undoubtedly become an even more integral part of modern agriculture.
Embracing these tools can lead to healthier crops, better yields, and a more sustainable future for farming. If you’re interested in exploring these technologies further, Google Earth Engine provides an accessible platform to start your journey into the world of hyperspectral remote sensing.


0% Positive Review (0 Comments)